Material and Energy Flow

Fiscal 2020 Environmental Impact of Business Activities

Input

Production Energy

NEW Home Order

Output

Production CO<sub>2</sub> Emissions

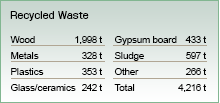
Production Waste

Production Energy

Factory

Production CO<sub>2</sub> Emissions

Production Waste

Transportation Energy

Trans-portation

Transportation CO<sub>2</sub> Emissions

Construction Energy

Constrctior Site

Construction C02 Emissions

Construction Waste

Input Total

Production, Transportation, and Construction  Energy Totals

Total

Output Total

Production, Transportation, and Construction  CO<sub>2</sub> Emissions Total

Production, Transportation, and Construction Waste Material Totals

Occupancy =>

Annual CO<sub>2</sub> Reduction in the Occupancy Stage 17,351 t-CO<sub>2</sub>

Disposal/Production

Demolition Waste Material Amount

M-Wood2 Manufacturing

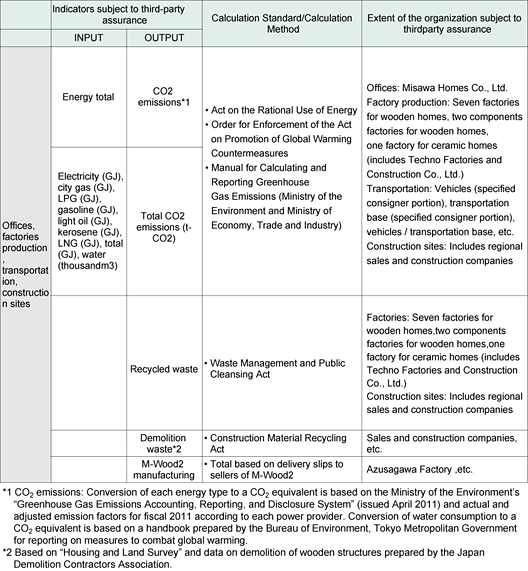
Calculation Basis for Consumption of Material and Energy

Calculation Basis for Consumption of Material and Energy

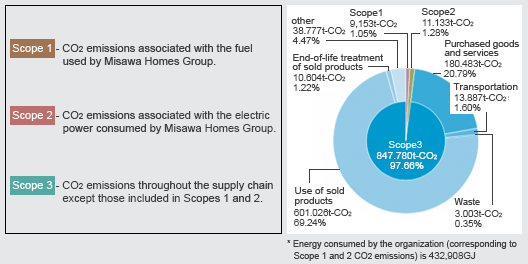
Fiscal 2016 Scope 1, 2, and 3 CO<sub>2</sub> emissions

The pie chart at below shows Scope 1, 2, and 3 CO2 emissions calculated based on the General Guidelines on Supply Chain Greenhouse Gas Emission Accounting. These guidelines have been recommended by the Ministry of the Environment and the Ministry of Economy, Trade and Industry since fiscal year 2016. Among emissions in Scope 3, we promote in particular the sales of eco-friendly homes that contribute to the reduction of CO2 emissions when occupied. Note that we calculated Scope 3 emissions, which refer to material procurement and occupancy stages based on single-family homes.
Fiscal 2014 Scope 1, 2, and 3 CO<sub>2</sub> emissions

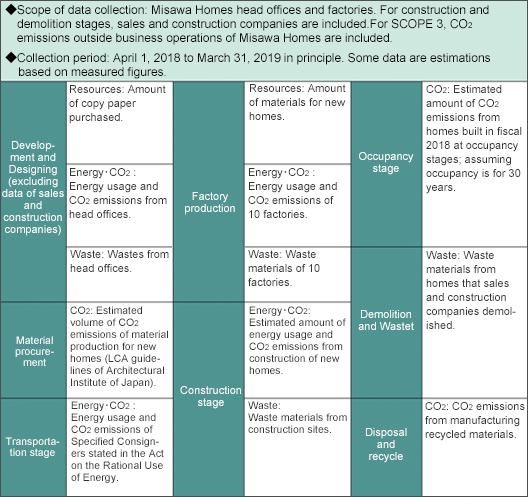
Precondition of Calculation

Precondition of Calculation


Top Page
About Misawa
Copyright © MISAWA HOMES CO., LTD. All Rights Reserved.